
Machine Learning techniques are rapidly advancing in the fields of weather and climate science. Machine learning has been used for analyzing and forecasting teleconnection patterns such as El Nino Southern Oscillation (ENSO, Barnston et al., 2012, Lima et al., 2015), seasonal forecasting (Cohen et al., 2018), clustering analysis for circulation patterns (Coe et al., 2021, Roller et al., 2016), and clustering analysis for extreme events such as extreme precipitation (Agel et al. 2018) and heat waves (Agel et al. 2021).
Deep Learning
Deep learning provides a more robust opportunity for real-time monitoring and forecasting of extreme events as well as general circulation patterns and weather. Neural networks have already produced promising results in the simulation of convection and clouds in models as well as in forecasting weather and extremes (Chattopadhyay et al. 2020), with convolutional neural networks becoming a powerful tool in both image processing and classification.
The Data Problem
Neural Networks are data intensive at their core, the more data you have, the better the model can learn. Unfortunately in weather and climate, as in many other scientific fields, there can be a lack of data depending on what is being studied. For example: Our study looks at Daily Circulation patterns over 40 years for the Fall season in the Northeast U.S. We use one model’s analysis (ERA-5) to identify the relevant patterns. This gives us a total of 7 patterns and 3640 days that are spread across these patterns. So, if we are lucky, each pattern on average has around 500 days in it, meaning we have 500 data points on which to train a neural network as to what each pattern looks like. The best neural networks have tens of thousands or more examples per class/pattern.

Deep Learning with Small Datasets
There is much difference between imitating a good man, and counterfeiting him.
Benjamin Franklin
In terms of Deep Learning, we have a small dataset. Testing a convolutional neural network with this small of a dataset leads to an accuracy of ~60% at best, which isn’t very useful to us when trying to predict the weather. There are a few alternatives though, when you have a small dataset. The first is to artificially create more images through transformations of the current images, transformations such as: rotation, zoom, flip, translation, etc. These normally work if we are identifying a picture of an object such as a dog or a cat, however, if we are looking at a weather pattern, rotating or flipping it will give a completely different pattern than what we started with!
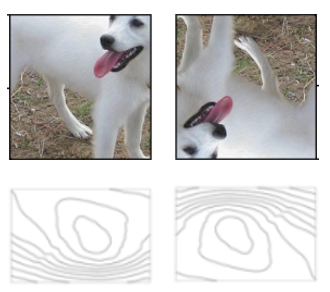 Even flipped, Fido is still looking like a dog. If we flip the weather, a low pressure system turns into high pressure!
Siamese Neural Networks to the Rescue!
When using a small data set for Deep Learning, the main alternative is to use it as a similarity/dissimilarity algorithm. This is the approach that is used for facial recognition technology on cameras and our phones! On our phones, we take a few images of ourselves, then the algorithm makes thousands of pairs between those images and images from databases across the internet. The images that we took when paired will have higher similarity than when paired with images from the database. This creates thousands of data points with which we can train our model, and we only needed a few images to start with!
An example of a siamese neural network
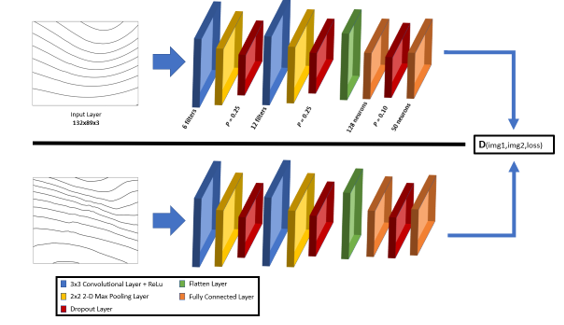
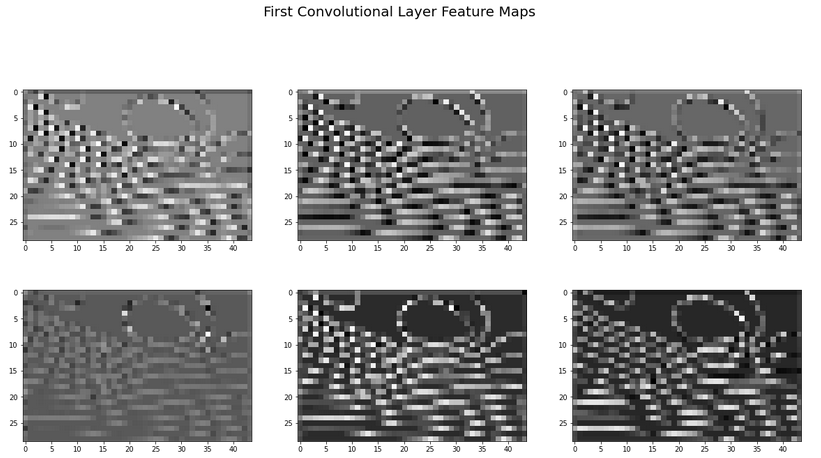
Since we have image pairs, we need two convolutional neural networks, one for each image. Each convolutional neural network is built exactly the same, this way they will have the same weights and biases when training and testing the data. As each image pair is fed into the model, the convolutional neural networks identify the prominent features of each image and “learn” how to identify them. This pares the image down into a feature map. Once each image’s feature map is output, the model calculates their similarity using a Contrastive Loss function.
Contrastive loss is a type of ranking loss that contrasts the distance between the output for a genuine example to an imposite (false) example of the same class, with a lower loss if a genuine example is closer to other genuine examples.
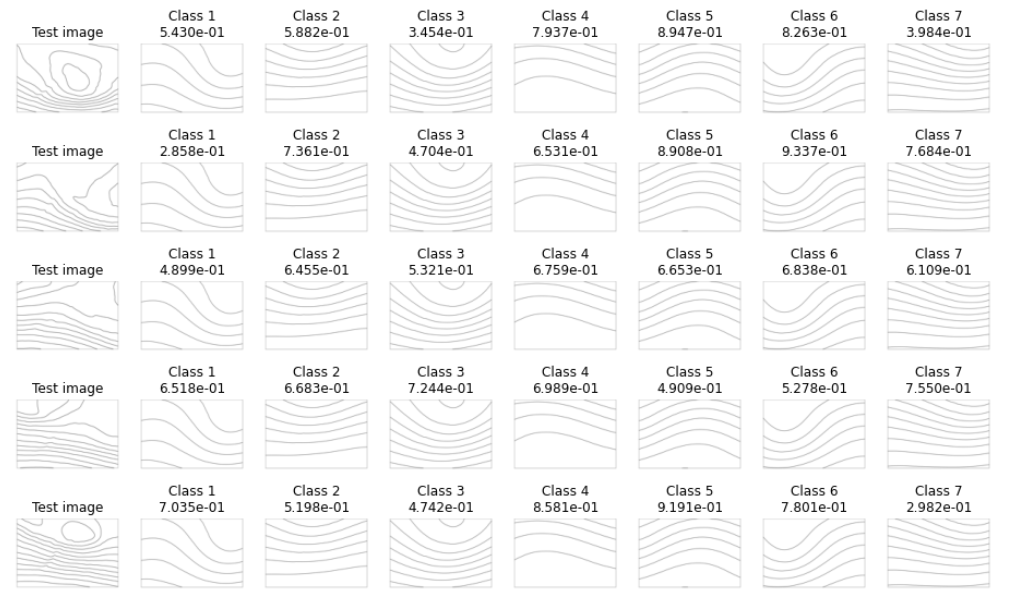
This methodology allows us to successfully match daily circulation data to existing daily circulation patterns, which can be useful for both short-term and long-term forecasting! This methodology can also be applied to any small data set, with the network being specifically built and tuned based on the samples being used.
For more information on the Fall Season in the Northeast U.S., its daily circulation patterns and how they develop and change throughout the fall season, and typical weather patterns during the season based on daily circulation, check out our paper in the Journal of Climate: Clustering Analysis of Autumn Weather Regimes in the Northeast United States