
By: David Coe
While many in the Southern United States have been dealing with a severe storm outbreak over the past few days, we dealt with our own “convective” outbreak last Sunday.
Snow squalls are fast moving snowfall events, featuring gusty winds, low visibility, and little to no snow accumulation. These events are similar to severe storms, where they require a little energy in the atmosphere to be able to spin up, and tend to be spatially smaller than their summer-time counterparts, making forecasting where they will occur difficult. Knowing how to forecast for a snow squall event and giving an approximate location of the squalls can save many lives, as the most destruction from these events occurs when squalls lower visibility on busy streets/highways.
Banacos et al. (2014) was one of the first studies on snow squalls in the Northeast U.S. to attempt to identify and describe a method for forecasting them. They identified weak CAPE (convective available potential energy) < 50 J/kg and high relative humidity near the surface. Using these two variables and a few others not explained here, they were able to create a snow squall parameter to help define favorable days for snow squall development. The National Weather Service (NWS) also began issuing Snow Squall Warnings 30-60 minutes ahead of events, similar to other severe squall event warnings.
One of our group’s current research projects is studying snow squalls for the southern and central portions of the Northeast U.S. to better understand the forcing mechanisms behind them. We found that there are three distinct types of snow squall events that we experience, one where squalls form off of the Atlantic Ocean, one where squalls form in Northern NH/ME, and one similar to those in Banacos et al. (2014) where the squalls move from northwest to southeast. All these event types have their own signature look based on convective energy, with slantwise convection being a main driver of these cases where CAPE is lacking. Let’s take a quick look at the event from last Sunday, which was a case where CAPE was available and spawned snow squalls.


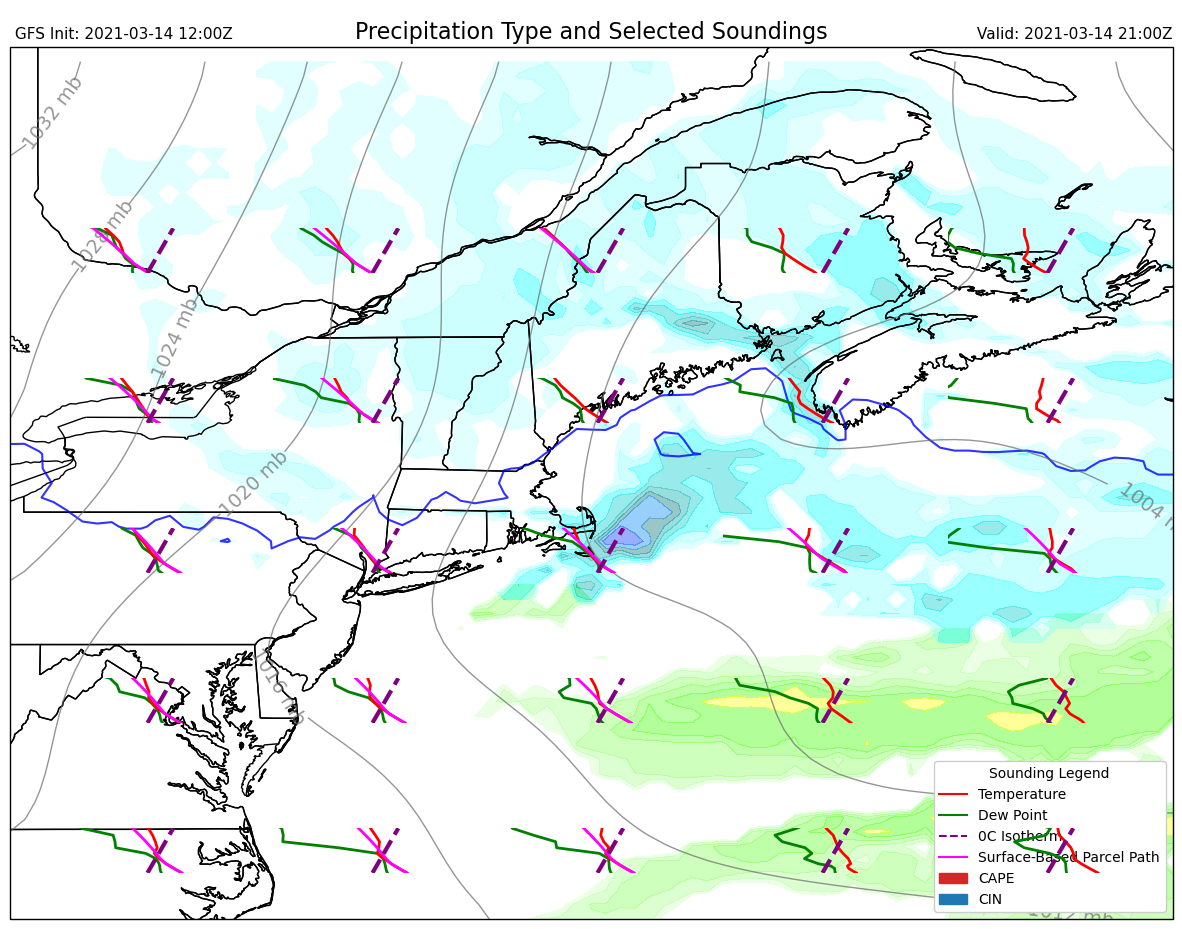
The above images show the state of the atmosphere at 12z on Sunday at 850 hPa, 500 hPa, and the surface. The image on the left shows the typical setup for the type of snow squall event we saw on Sunday: 1.) At the surface, a low pressure system off to the northeast of the region. 2.) A mid and upper level trough over the region. These are not the only ingredients necessary to mark a day as likely to produce snow squalls, as mentioned previously, CAPE/slantwise convection and relative humidity play a big role.


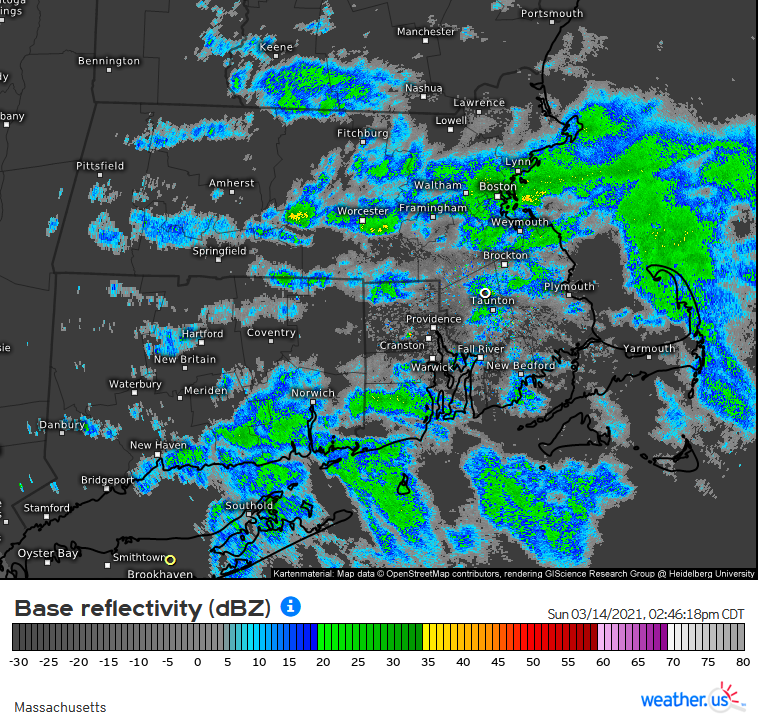
Relative humidity (not shown) at the surface was high over the Northeast U.S., conducive of an environment that is primed for snow squall activity. The images above are from the GFS analysis for Sunday, showing the precipitation type (colored) as well as a skew-T diagram over multiple locations along the region. Skew-T diagrams can be confusing, so the point to make here is any that feature the smaller, fuchsia colored line have CAPE present. Looking at the time series, CAPE is present in Southern and Central New England, as well as NY State, matching the locations where squalls occurred during the day (see above radar image). These squalls were originally driven off of the Great Lakes, and sustained by the convective energy available over Southern New England. This CAPE caused multiple smaller squall cells to spawn throughout the afternoon in Southern NH and Massachusetts.
While these are only a few of the many variables involved in forecasting snow squall events, for the event type we saw on Sunday, CAPE, RH and low-level winds are the most important factors.
Special thanks to Jack Sillin for his Python script to be able to produce the Skew-T plot overlays. https://github.com/jsillin/SoundingMaps
References:
Banacos, P. C., Loconto, A. N., & Devoir, G. A. (2014). Snow squalls: Forecasting and
hazard mitigation. Journal of Operational Meteorology, 2(12), 130-151.