
by Mathew Barlow, UML Professor of Climate Science
During the 2018-2019 Northern Hemisphere winter, a major Sudden Stratospheric Warming (SSW) occurred in association with the breakdown of the Polar Stratospheric Vortex.
The following video shows the evolution of the vortex starting from a strong circulation in late Dec 2018, through the breakdown in early Jan 2019, and into recovery by the end of Feb 2019. The evolution is shown in terms of potential vorticity and winds on the 850K isentropic surface (about 30km up, in the middle of the stratosphere).
Potential vorticity is a measure of rotation in a fluid that accounts for both speed of rotation and distribution of mass, analogous to angular momentum. A brief, equation-free introduction to potential vorticity is available at:
https://storm.uml.edu/~metweb/Blog/?p=330 .
Note that the winds show a counter-clockwise (cyclonic) rotation around the highest values of potential vorticity (yellow colors).
Here are three snapshots of the vortex before, during, and after the breakdown:
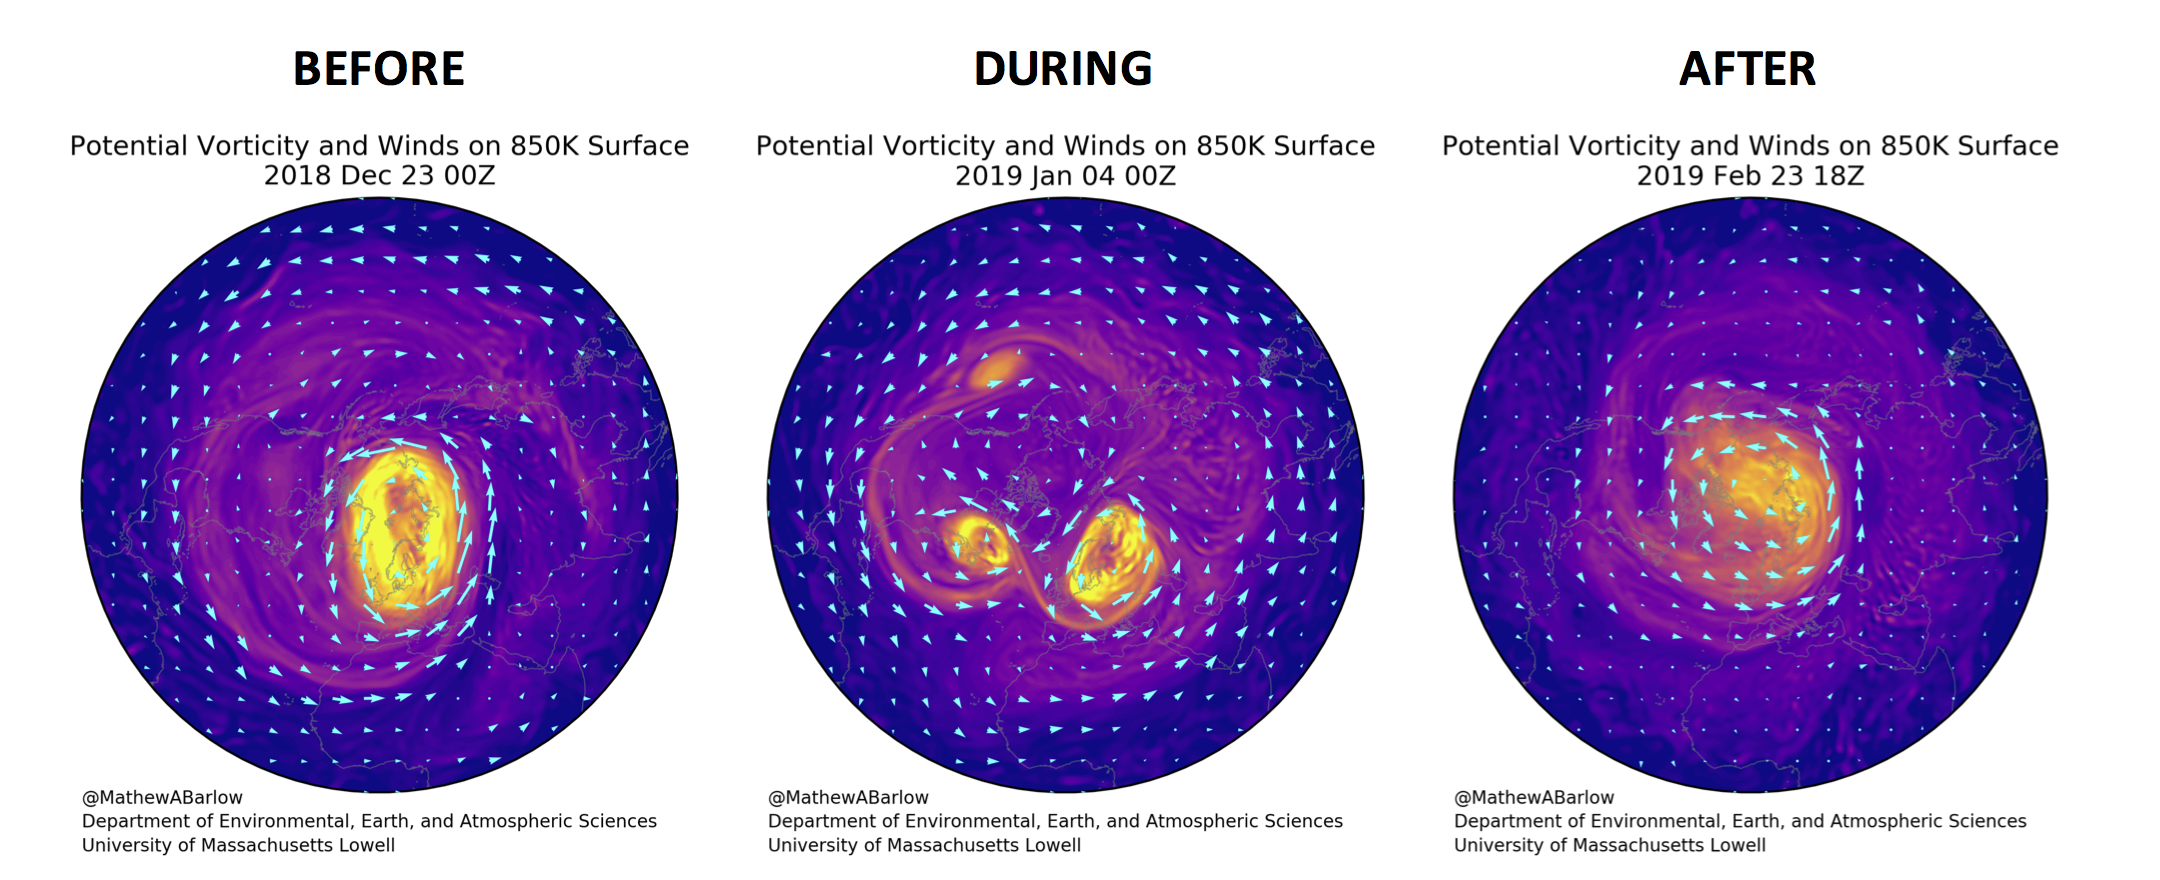
Before the breakdown there is a single large area of cyclonic rotation close the North Pole – this is the Stratospheric Polar Vortex. This circulation splits into three smaller pieces that move around and interact, with the two larger pieces eventually merging via a Fujiwhara-like interaction. During the breakdown, the winds are circulating clock-wise around the pole, which is opposite to their usually direction. Eventually, a strong vortex redevelops. The values of potential vorticity are not as high in the recovered vortex as in the initial vortex, but are typical for that time of year.
The data is from NOAA’s CFSv2 operational analysis at 6-hour intervals, which is available online:
For more information on polar vortex terminology:
https://journals.ametsoc.org/doi/10.1175/BAMS-D-15-00212.1 .
The average surface impacts associated with sudden stratospheric warmings (SSWs) can be explored at:
https://www.esrl.noaa.gov/csd/groups/csd8/sswcompendium/ .
For instance, here is the average surface temperature anomalies observed in the 30 day-period after past SSWs.
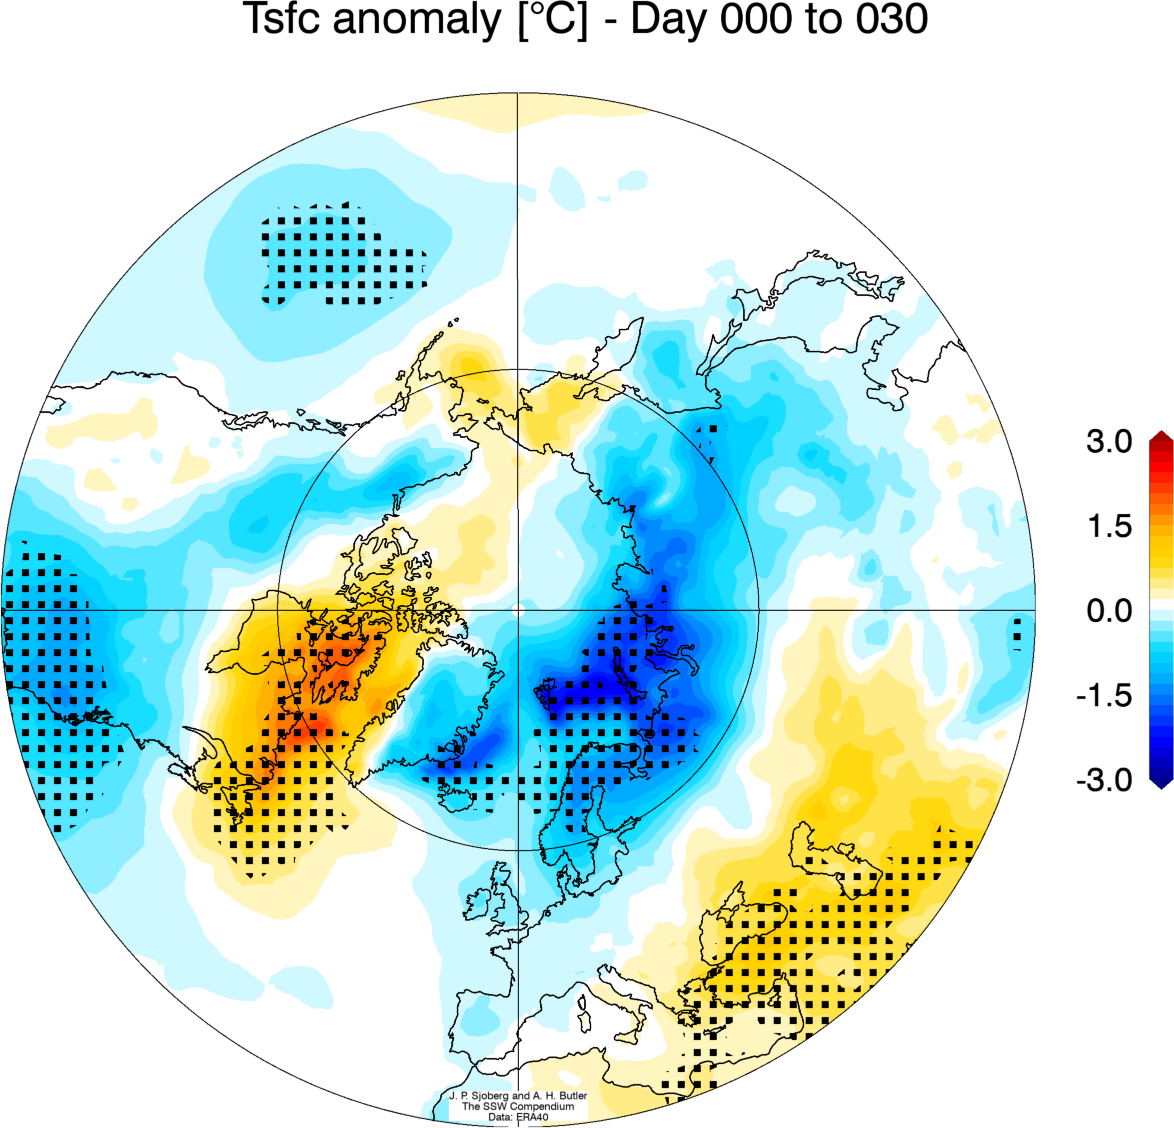
This average pattern of surface temperature anomalies does not occur after every SSW, however. The predictability of the tropospheric impacts of SSWs is examined in:
Acknowledgements
This discussion is part of outreach efforts for NSF AGS-1657921.