by Dr. Mathew Barlow, UML Professor of Climate Science
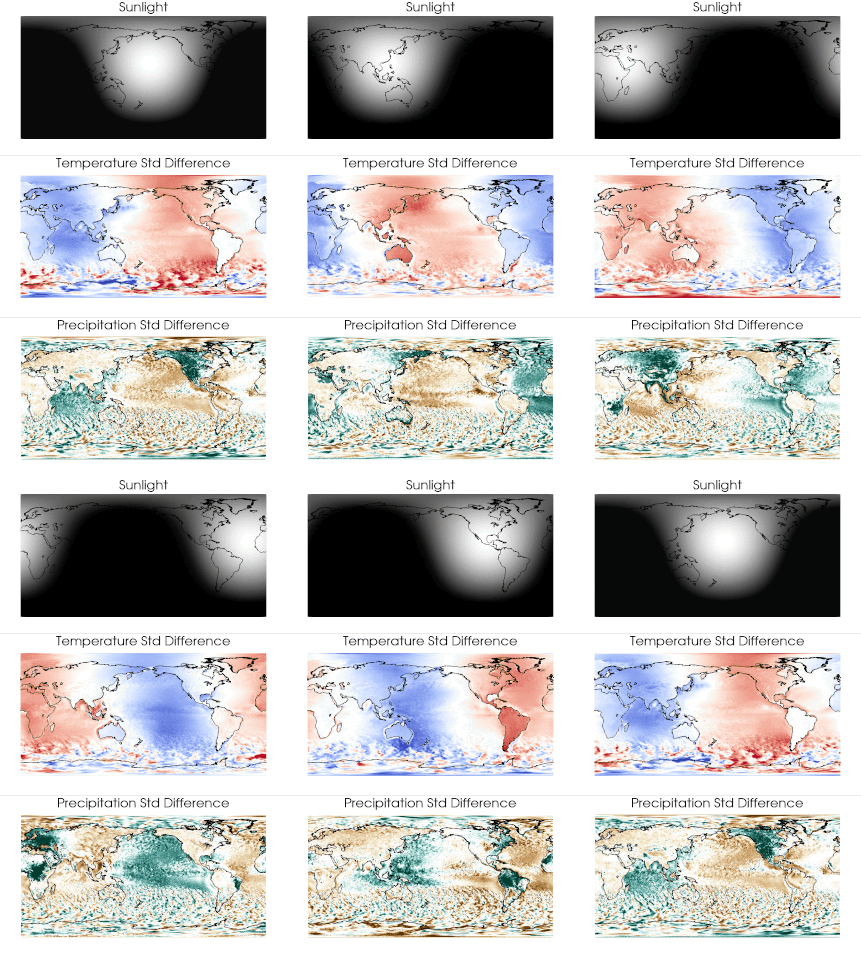
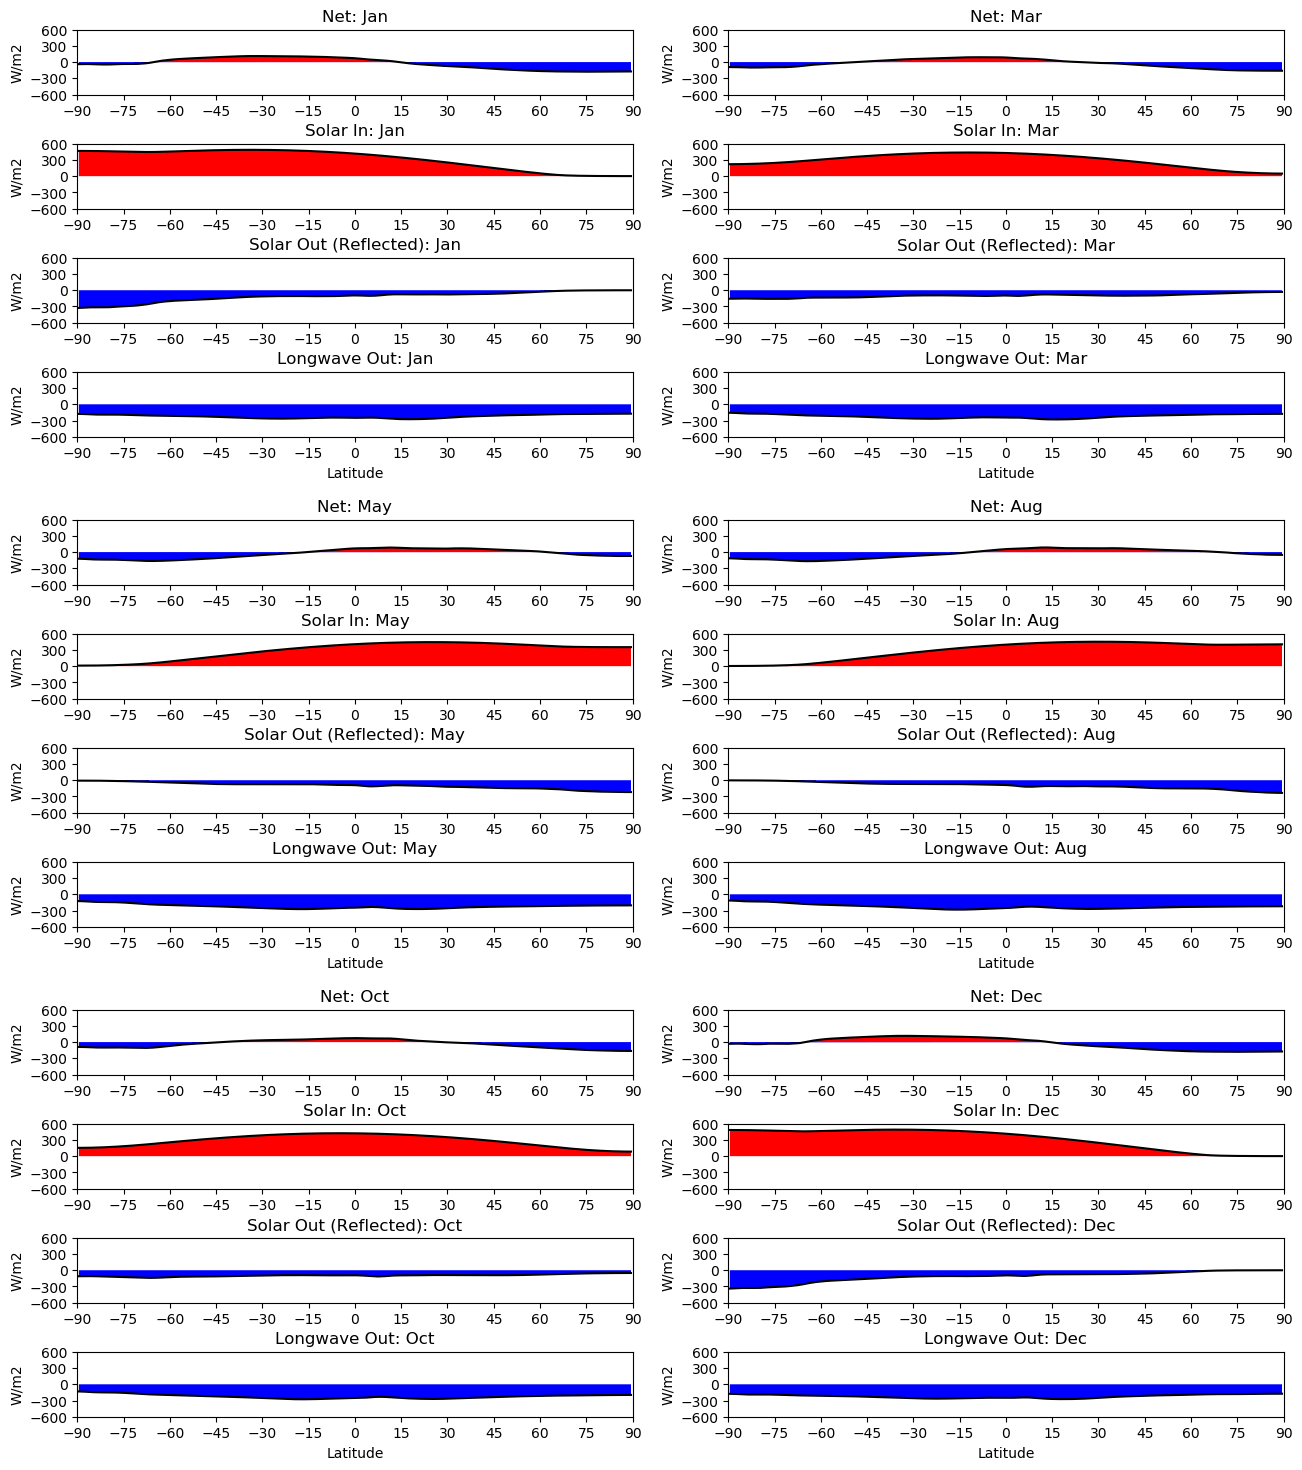
This post collects some of the weather and climate visualizations I made in 2020.


by Dr. Mathew Barlow, UML Professor of Climate Science
This post collects some of the weather and climate visualizations I made in 2020.


