
by Dr. Mathew Barlow, UML Professor of Climate Science
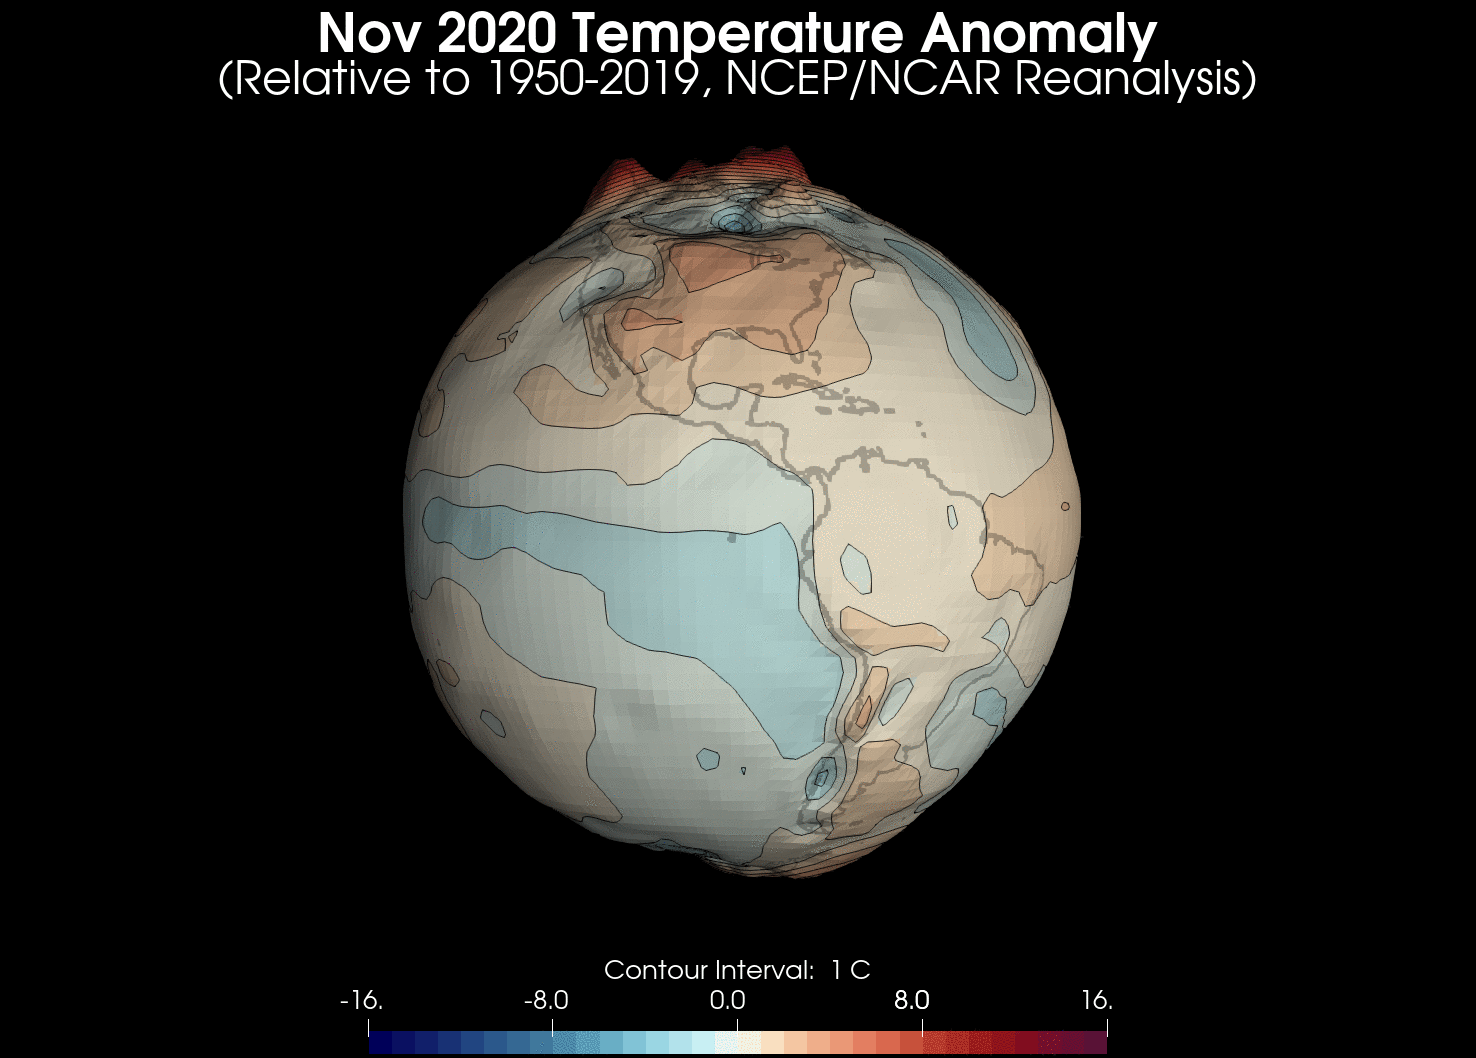
Globally, November 2020 was the warmest November on record: https://climate.copernicus.eu/surface-air-temperature-november-2020

The reds indicate temperatures warmer than the 1981-2010 average and the blues indicate temperatures colder than the 1981-2010 average. (The 1981-2010 period is the current international reference period.) You’ll notice a lot of red.
While temperatures for any specific location and any particular month are strongly influenced by weather and natural climate variability, the fact that the map shows mostly warmer-than-average temperatures is due to human-caused climate change.
Of the globally-averaged warming that’s occurred over the last 150 years, roughly how much has been caused by humans? All of it: https://www.carbonbrief.org/analysis-why-scientists-think-100-of-global-warming-is-due-to-humans
You probably noticed that the largest temperature differences are in the Arctic region – this is known as “Arctic Amplification.” Here it is highlighted in a 3D perspective animation:
That animation uses a slightly different dataset and reference period from the first figure but shows the same overall picture. The 3D perspective is inspired by Greg Fiske’s excellent graphic of projected temperatures, which show similar features:
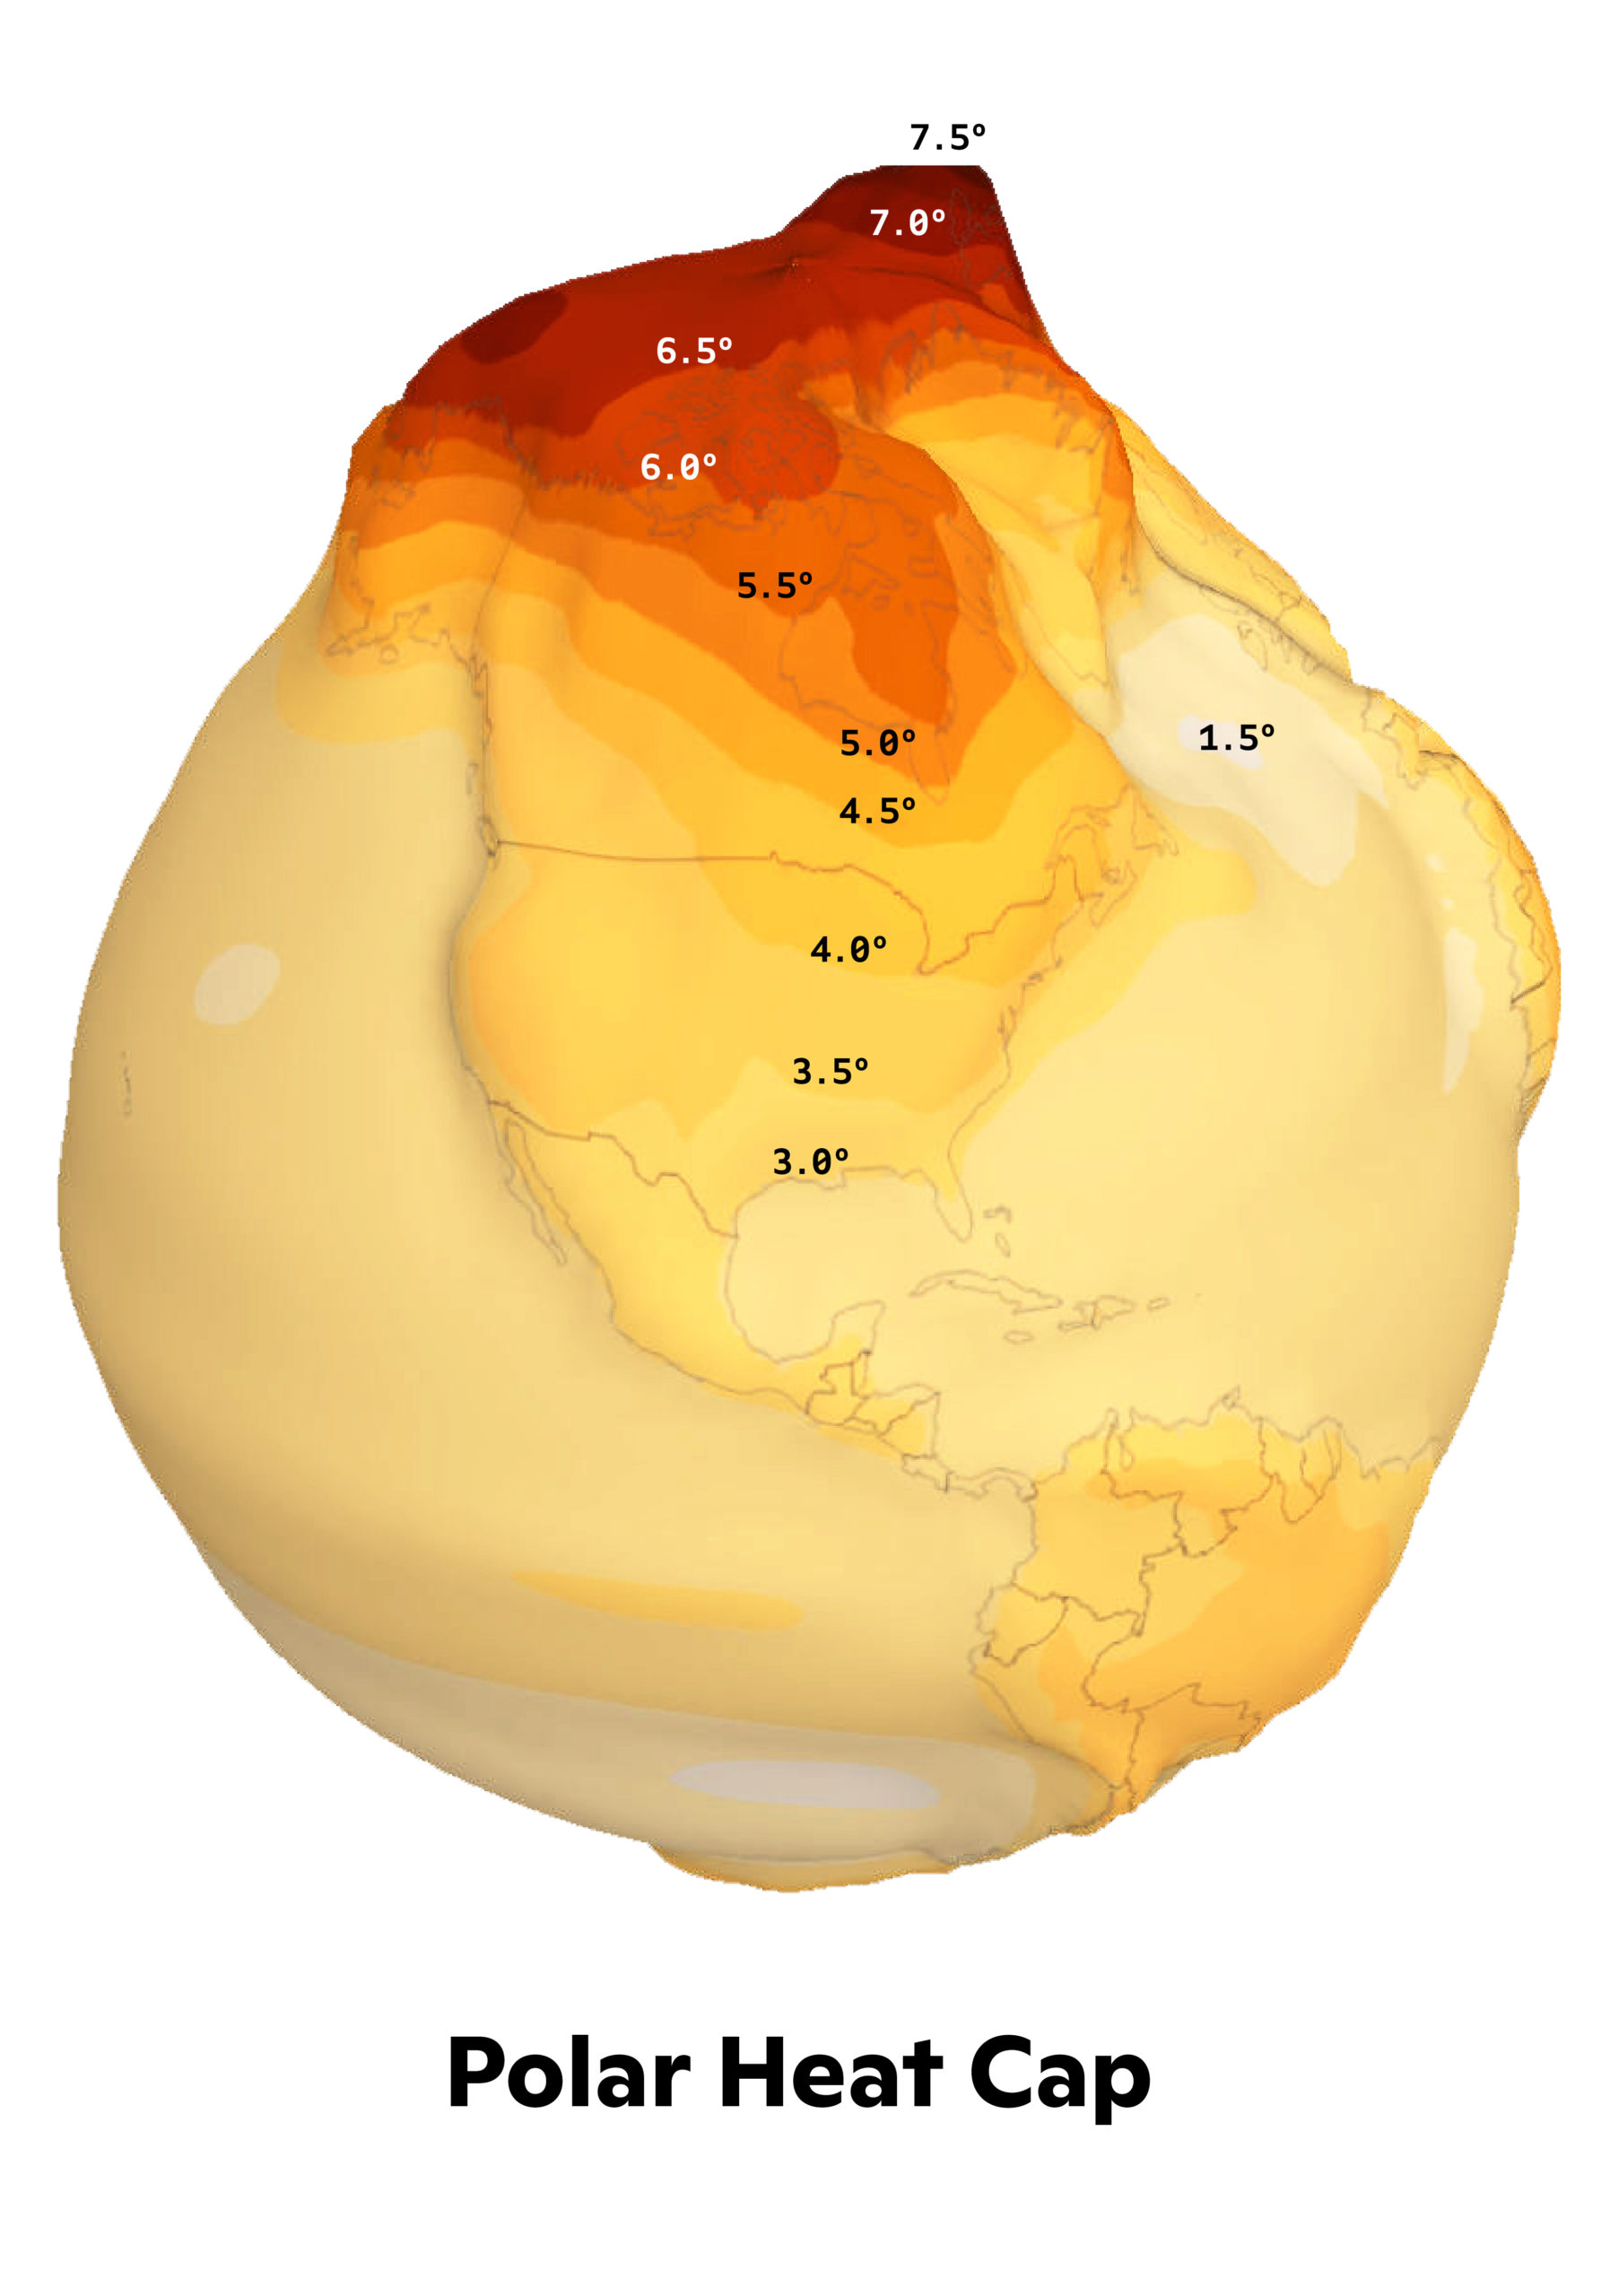
The projection shown is for mid-century temperature increases relative to 1880-1920, based on RCP 8.5 emissions: https://twitter.com/WoodwellClimate/status/1299030866988019712
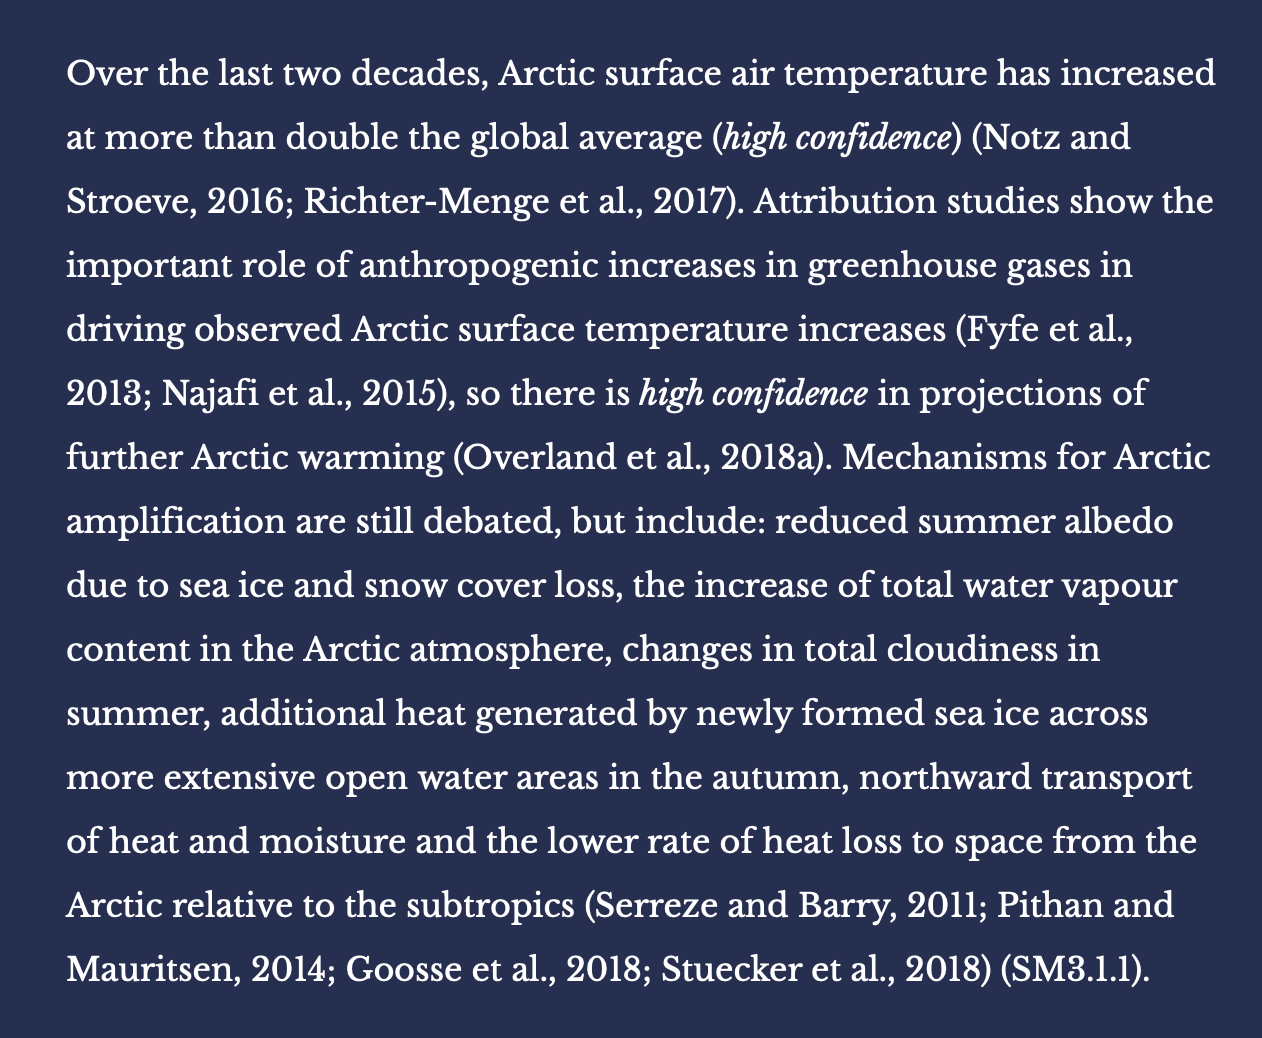
Arctic Amplification is a robust feature of both observed and projected temperature changes. The causes are an area of active research and involve a number of different factors. There’s a nice summary of the current state of understanding in Box 3.1 of the IPCC SROCC report: https://www.ipcc.ch/srocc/chapter/chapter-3-2/
You may also have noticed the colder-than-average temperatures in the tropical Pacific. Those are associated with the “La Niña” phenomenon, the opposite phase of El Niño; both of which are naturally-occurring. La Niña has characteristic global impacts; for instance, on rainfall:
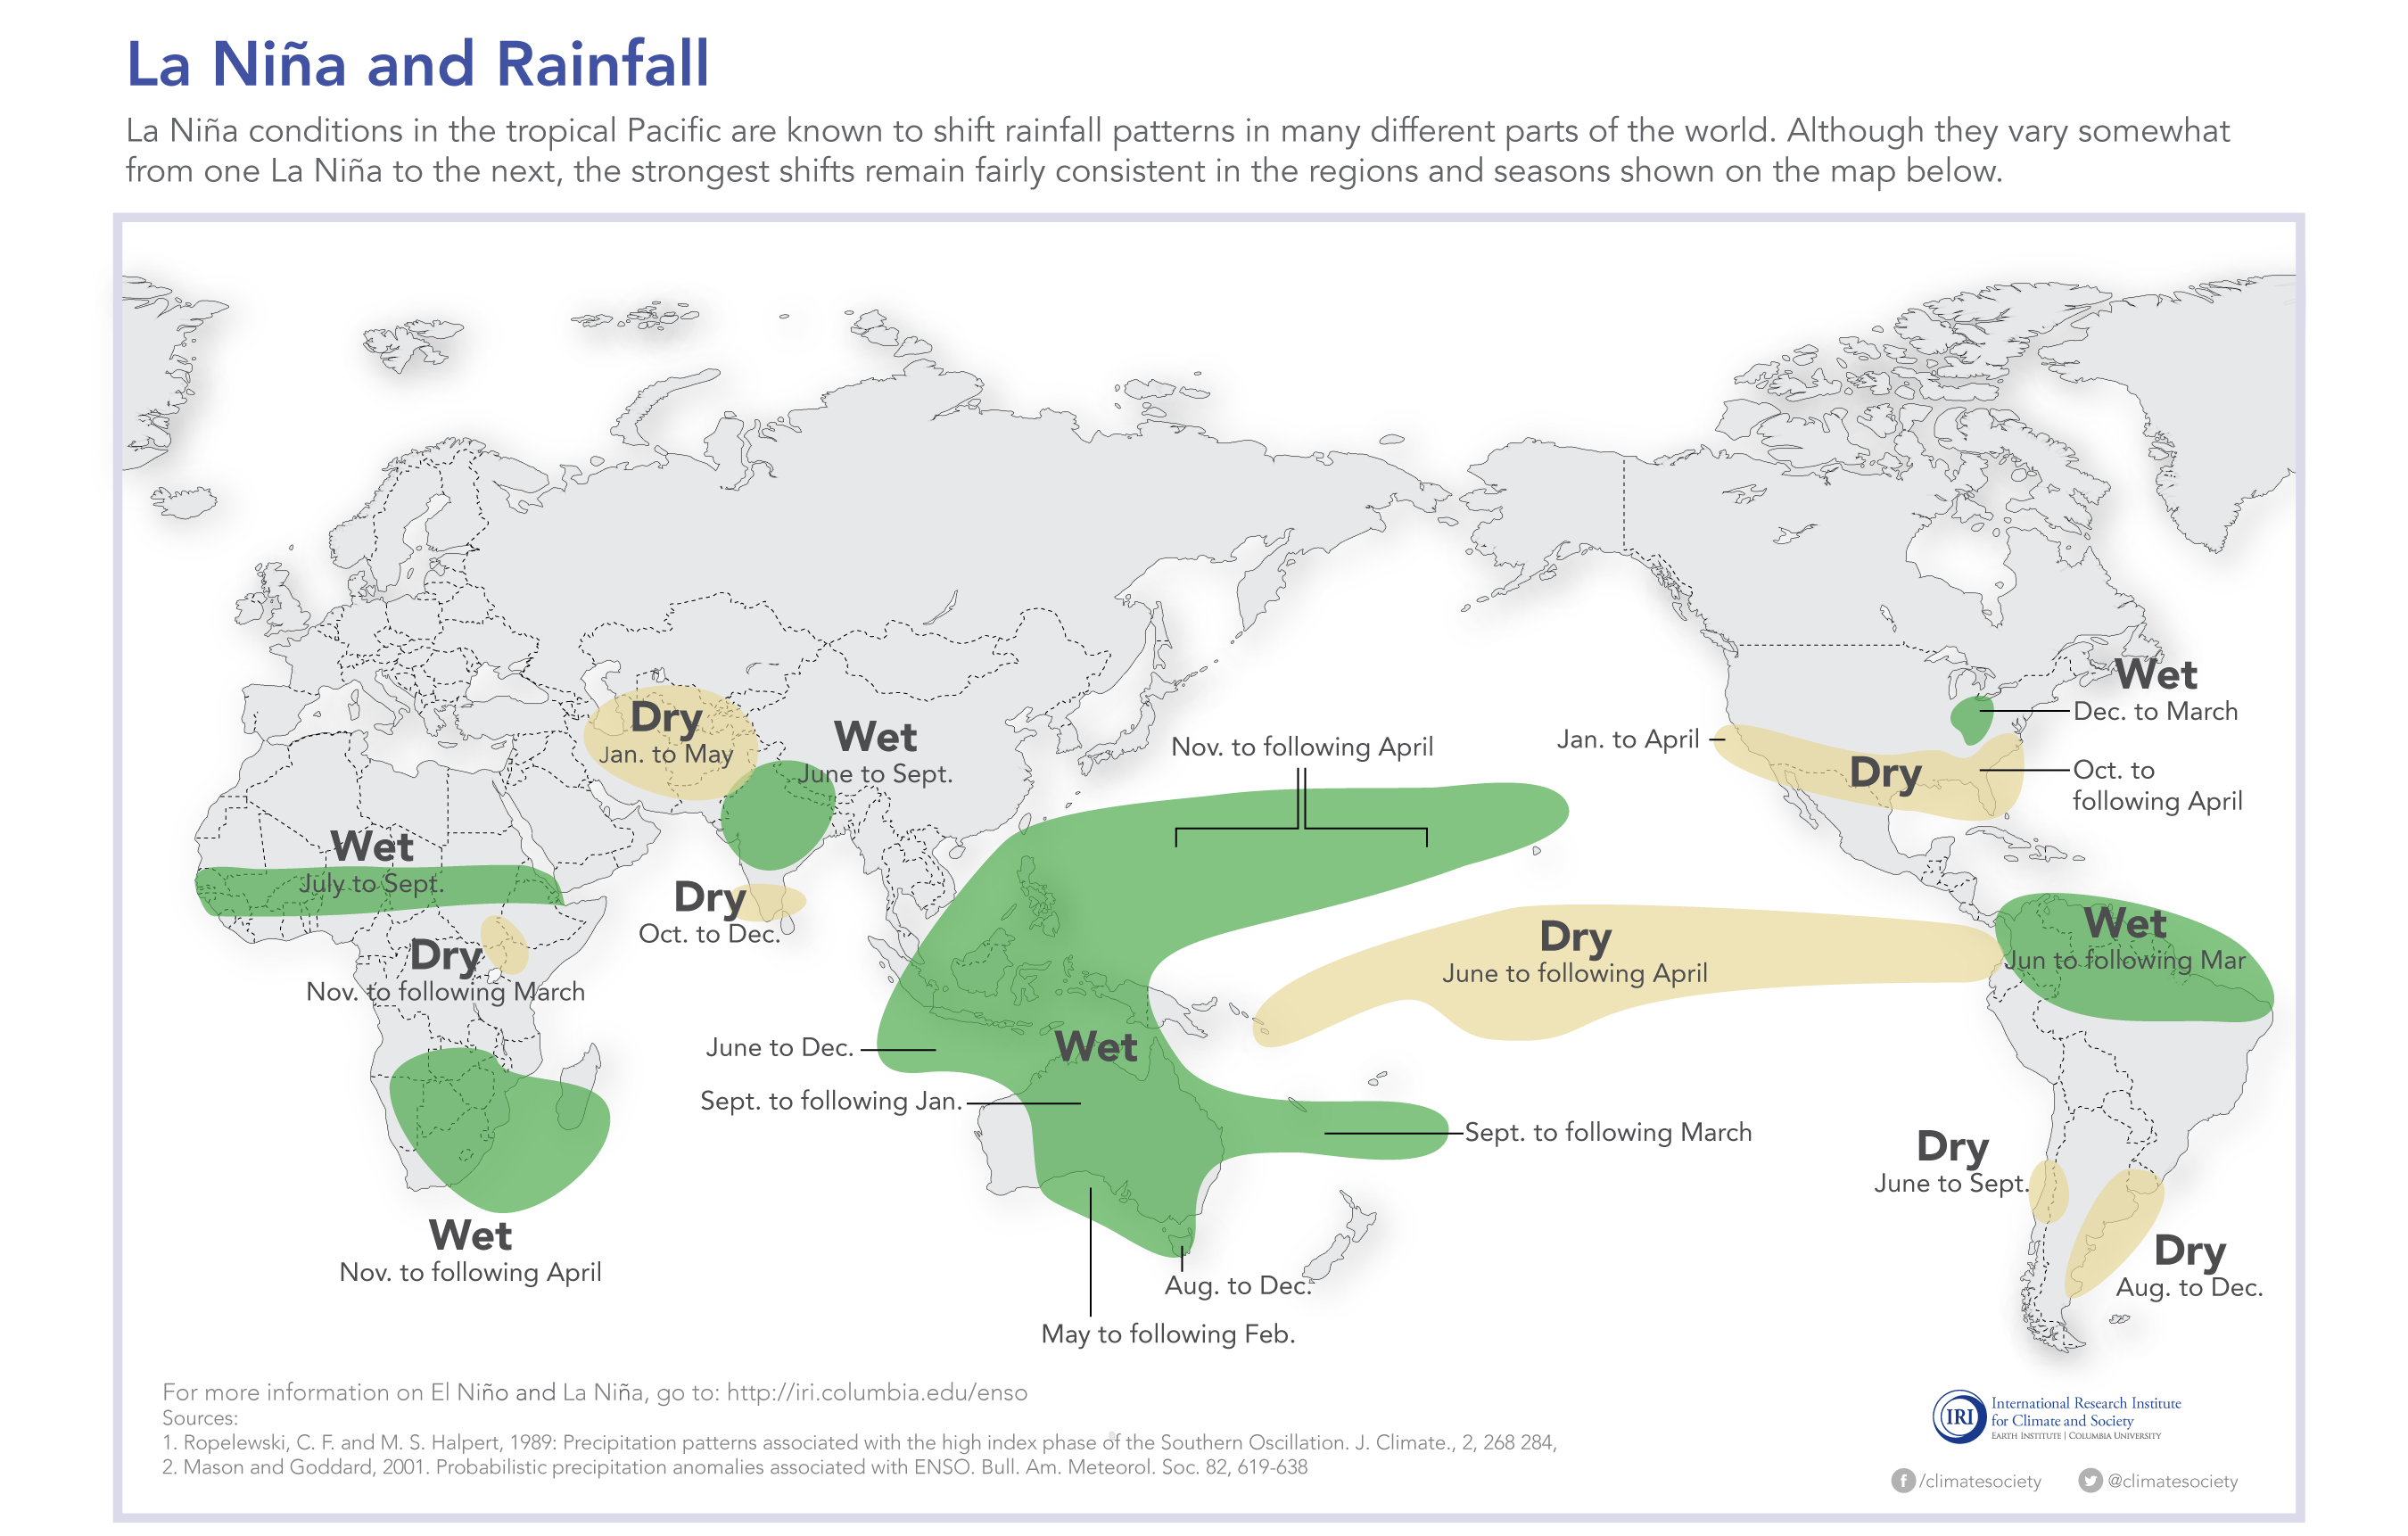
More information on the current state and forecasts for La Nina is available at: https://iridl.ldeo.columbia.edu/maproom/IFRC/FIC/laninarain.html
For more information on our department at UMASS Lowell, please see https://www.uml.edu/sciences/eeas/ and for more information on the campus’ climate change-related activities, please see https://climatechangeinitiative.org.